
Dashboards, Analytics & Predictions
We build dashboards, collectors, and predictive models around concrete decisions — from organizing sources to automated reporting.
fromPLN 15,000
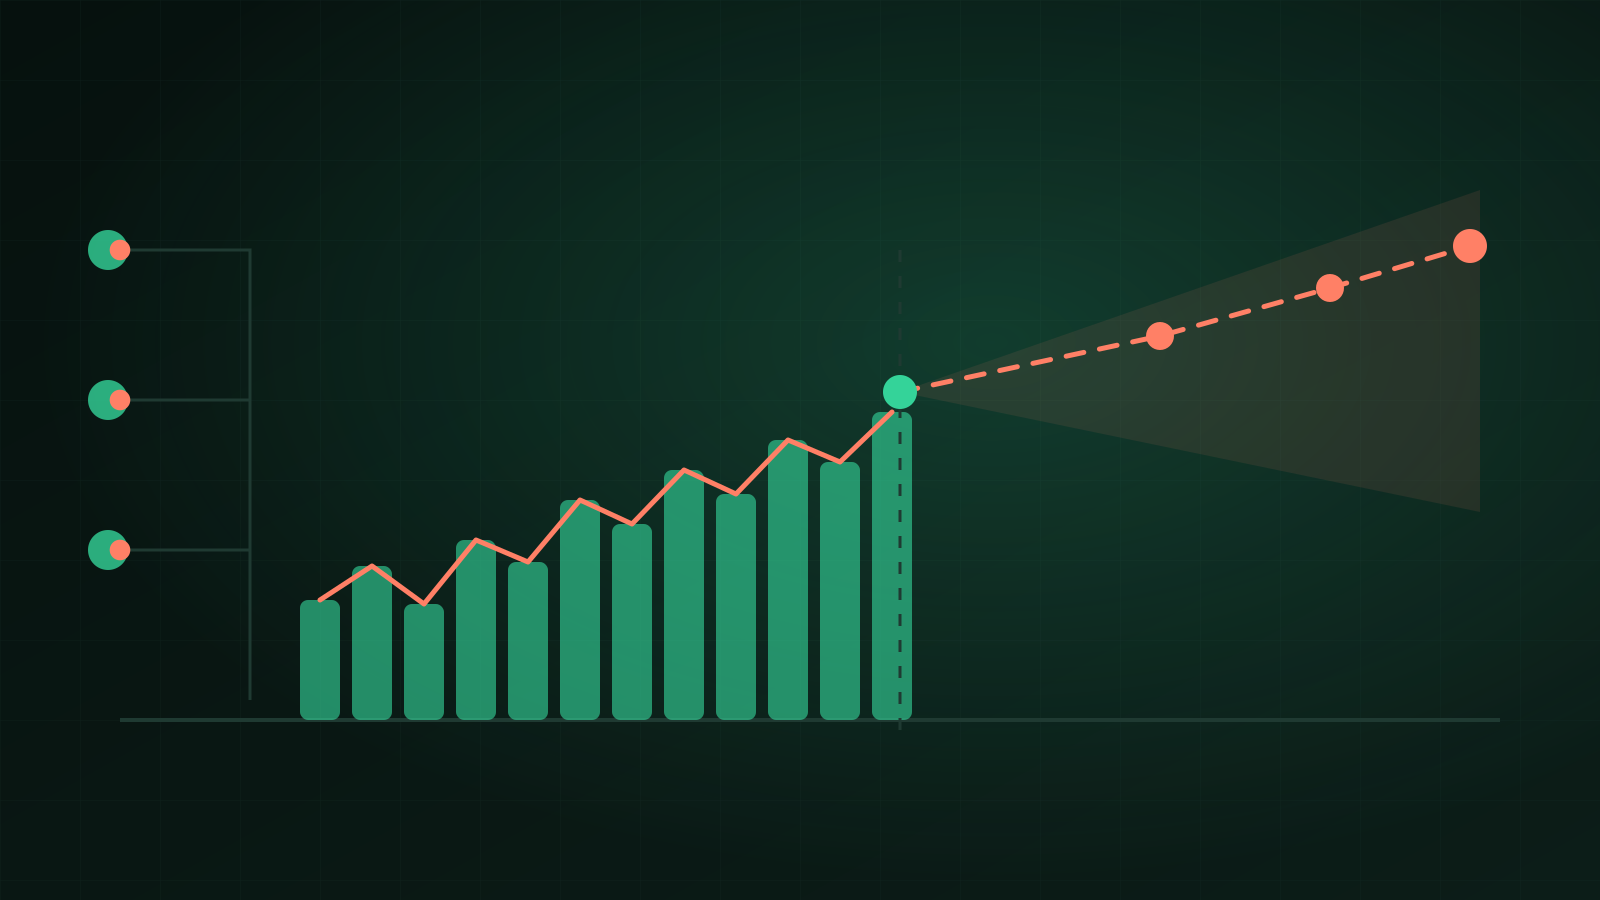
An analytics system connects data from multiple sources, gives it shared definitions, and shows the metrics needed for a specific decision. The dashboard answers "what's happening?", automated reporting delivers that answer on the right cadence, and a predictive model estimates "what might happen next" with uncertainty.
When You Need This
- Data sits in ten places and no one sees the full picture.
- Board or investor reports are built manually in spreadsheets, from scratch every month.
- Decisions land after the fact, even though the signal was in the data earlier.
- Seasonality throws off planning and you want to forecast demand, sales, or churn.
- Different departments use the same metric names but calculate them differently.
What Question Do We Start With?
We don't start with a chart list. First we define the decision and the action that follows:
- whether to increase stock or capacity for the next period;
- where the biggest drop-off occurs in the sales process;
- which source or segment needs the team's attention;
- whether a deviation is signal or normal variance;
- who needs the report and how often.
If a chart doesn't lead to a decision, it probably shouldn't take up space in the first panel version.
What the Data Layer Looks Like
- Definitions. We align key metrics (KPIs), time ranges, sources of truth, and data owners.
- Collectors. We pull data from APIs, databases, files, or operational systems and log errors.
- Storage. We design the data model for history, corrections, and expected query patterns.
- Presentation. We build dashboards and automated reports for specific audiences.
- Prediction. Only with sufficient history do we create a model, measure error, and define a retraining plan.
What You Get
- a source catalog and unambiguous definitions of key metrics;
- collectors with error logging and data completeness checks;
- a database and data model fitted to history and anticipated queries;
- a dashboard with views derived from audience roles;
- automated reports and alerts where manual checking makes no sense;
- an optional predictive layer with documented error, assumptions, and a retraining plan.
A dashboard connecting several sources runs roughly 15,000–40,000 PLN. A platform with collectors, history, and automated reporting typically falls in the 40,000–120,000 PLN range. The predictive layer is priced only after assessing history and data quality.
What Proof Do We Have?
We built and maintain an analytics platform on TimescaleDB ourselves. It showcases collectors, time-series storage, dashboards, and reporting as a Condictor product — not a client reference. That lets us discuss architecture on a real system.
When Prediction Doesn't Make Sense Yet
When history is too short, the process has fundamentally changed, data has gaps, or no one will act on the output, a model only creates the illusion of sophistication. In those cases we start with measurement and reporting.
What the First Step Looks Like
On a short call we pick one decision, one audience, and the sources. If data already exists and is accessible, scope can start with a dashboard. If not, the first deliverable is collectors and quality control. Only then do we price prediction honestly.
Describe your sources, reporting cadence, and decision in the brief. The technical architecture is shown in the stack, and how we run projects in process.
FAQ
Will you build this on our data?
Yes. We pull from agreed sources — systems, APIs, files, and databases — and design a unified history model. Query speed depends on volume, quality, and update frequency, so we measure it on the target scope.
How do predictions differ from a regular report?
A report describes historical data; a predictive model estimates a future outcome or event probability with an error margin. A forecast isn't a certainty; it's meant to support decisions and be regularly compared against reality.
Who has already built such a platform?
We have, for ourselves. We run our own analytics-predictive platform on TimescaleDB: collectors operate as monitored services, the whole stack runs on a VPS, and recurring reports are generated from the data.
How long does implementation take?
A first dashboard connecting a few sources typically takes a few weeks. The predictive layer is a separate phase — we add it once data is flowing and has quality.
Do I have to click through reports in the panel myself?
No. Recurring reporting generates automatically and lands where it needs to. The panel is for those who want to go deeper than the report.
What if our data is incomplete?
We start with a quality and gap assessment. Sometimes the first step is collectors, key metric (KPI) definitions, and a few weeks of data collection — not a flashy dashboard. We surface this condition before pricing the predictive layer.