
What is a knowledge graph?
A knowledge graph stores entities and their relations. We explain the difference from vector databases and when RAG without a graph cannot answer your question.
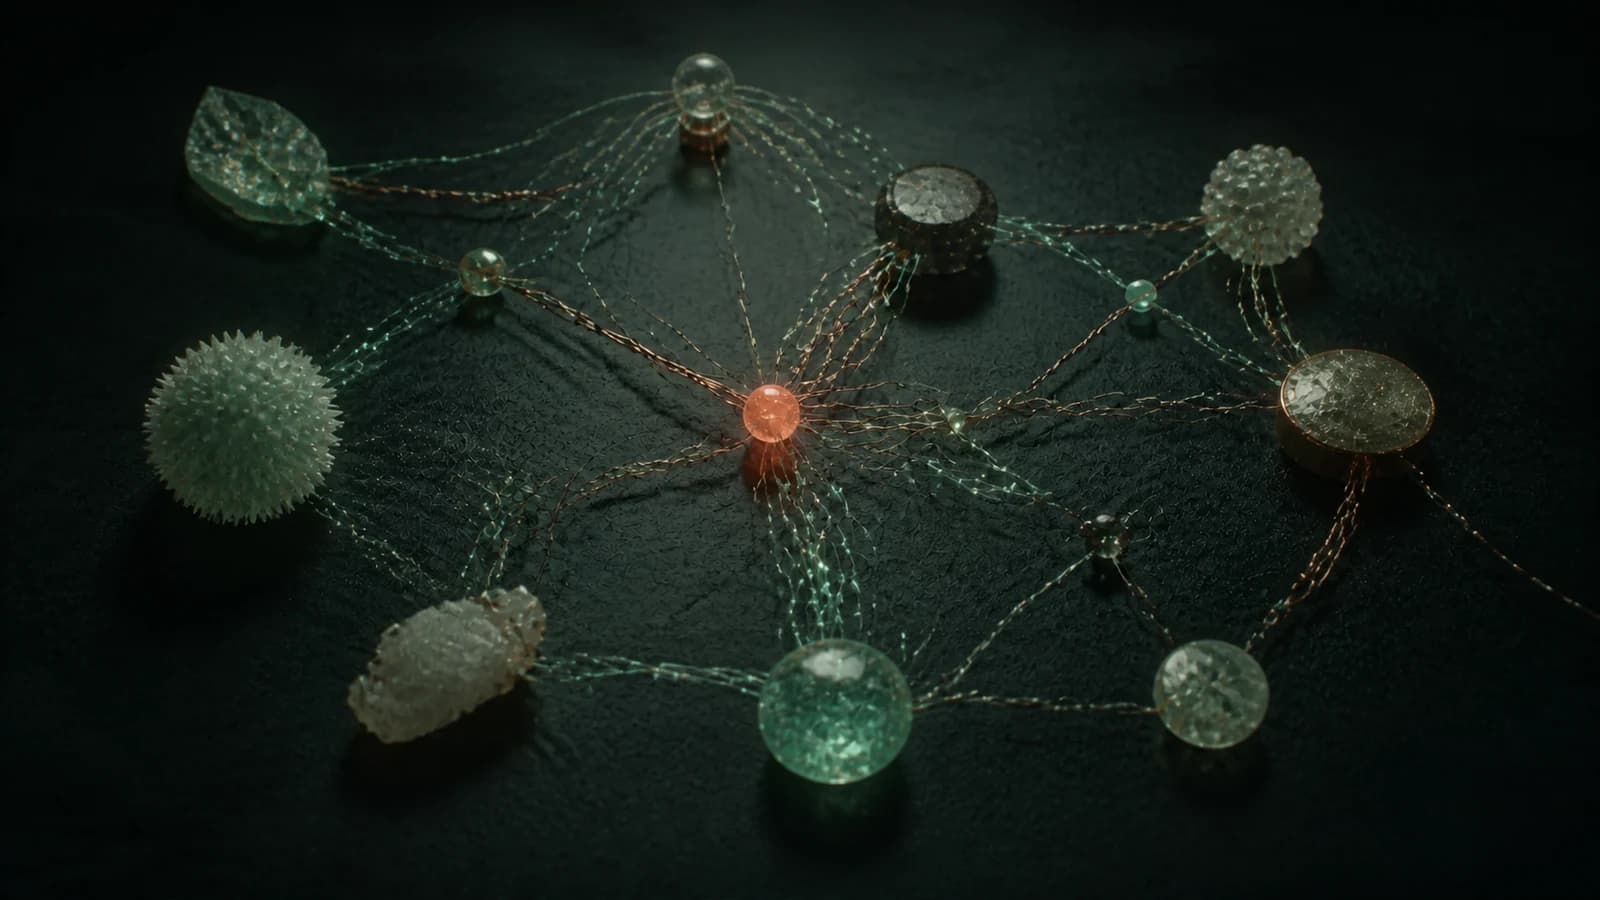
A knowledge graph is a way of representing knowledge as a network: entities are points and the relationships between them are edges. Instead of storing only the sentence “agreement 14/2024 concerns subcontractor Kowalski and ends on 2026-12-31”, a graph can store the agreement and subcontractor as entities, their relationship, and the end date as an attribute — so those elements can be queried explicitly.
The difference feels academic until you ask a question that fragment retrieval cannot answer.
When fragment retrieval stops being enough
RAG can retrieve passages relevant to a question. It fits questions such as “what is our complaints procedure” well. Fragment retrieval alone may be insufficient, however, when the answer is not written in one place but follows from combining several facts:
- “Which subcontractor agreements expire before the next audit?”
- “Who in the company worked on projects for clients in the transport sector?”
- “Which systems depend on the integration we want to shut down?”
When the answer does not occur in one passage, several facts need joining. A graph is one of the architectures that makes this traversal and the resulting path easier to show.
A knowledge graph versus a vector database
| Vector database (RAG) | Knowledge graph | |
|---|---|---|
| What it stores | text fragments and their meaning | entities and their relationships |
| Answers | “where is this written?” | “how are these things connected?” |
| Multi-step question | depends on retrieval method and tools | naturally supports traversal over relationships |
| Preparation cost | depends on sources and evaluation | adds a relationship model and entity normalisation |
| Update | add a document | fit data into the schema |
| Explainability | “it comes from this document” | “it comes from this relationship path” |
These approaches can be combined, but that is not automatically the best choice. A graph helps with relationships and aggregation, while text retrieval supplies passages to cite. One implementation of this pattern is Microsoft GraphRAG, which extracts entities, relationships, and claims from text. The cost of indexing and maintaining a graph still needs to be justified by questions a simpler RAG system cannot serve.
What a knowledge graph consists of
Three concepts, and that is the end of the theory:
- An entity — something you talk about: a customer, agreement, product, person, project, or system. It has a type and an identifier.
- A relationship — a named connection: “agreement concerns customer”, “person worked on project”, “system depends on integration”. A relationship has a direction.
- An attribute — a property of an entity: date, amount, status.
An important part of the work lies in deciding what is an entity, a relationship, and an attribute. Those boundaries need to be resolved with people who know the domain and then checked against real questions; correct graph syntax alone does not ensure usefulness.
How a graph is built from documents
The sequence we use:
- Domain model. List entity types and permitted relationships. Without explicit rules, inconsistent names, duplicates, and queries whose results are difficult to interpret become more likely.
- Extraction. A language model can read documents and propose entities and relationships according to the model. Automation reduces the cost of manual work on a large collection, but its output still needs quality control.
- Entity normalisation. “Jan Kowalski”, “J. Kowalski”, and “Kowalski Jan” may mean the same person. The merging rule needs identifiers and uncertainty handling so it does not combine two different people.
- Verification. A human checks a sample of relationships, alongside consistency rules (“an agreement cannot end before it begins”).
- Querying. Graph queries plus a language layer that converts the user’s question into a graph query.
When a knowledge graph is not a good fit
To be honest, because this is a tool that is easy to overuse:
- When questions are simple and factual. “What is procedure X?” does not need a graph. RAG alone is enough and will be cheaper.
- When the domain is unstable. A graph needs a schema. If the nature of entities itself changes every month, the schema will constantly be out of date.
- When nobody can resolve the domain model. Without a person who knows how the company really works, you will create a graph consistent with documents and inconsistent with reality.
- When data is scattered and contradictory. A graph does not fix disorder — it fixes it in a form that looks precise. That is worse than visible disorder.
What it gives in practice
Three outcomes for which a graph is worth considering and testing on real questions:
- Answers to questions that take several steps without digging through folders.
- The ability to trace the basis. You can see the relationship path used by the query. In risky decisions, this helps verify a result, but it does not replace checking data and rule correctness.
- Better control of an answer’s basis. A graph path and citation make verification easier, but do not guarantee correct extraction or generation.
What does it cost?
A graph is usually a module of a larger second brain project, not a separate purchase. In our ranges as of August 2026, a pilot costs 12,000–30,000 PLN net, and a production system 30,000–120,000 PLN net. A graph expands the scope with a domain model, entity normalisation, and relationship tests.
Frequently asked questions
Do we need a special database?
Not always. For smaller graphs, relationships fit in ordinary PostgreSQL. We choose a dedicated graph database when queries become deep and performance starts to matter.
Who maintains the graph after implementation?
The extraction of new documents can be automated, but someone must resolve doubtful cases and domain-model changes. The owner and review frequency are established according to risk and the pace of change.
Can we start without a graph and add it later?
Yes, and that is usually what we recommend. Start with RAG, measure the questions on which the system fails, and add a graph only where relationships are genuinely missing. The reverse order is building by intuition.
We also build knowledge graphs for ourselves — our knowledge-graph tools are described in the laboratory. This is not someone else’s implementation we read about, but something we maintain in practice. If your questions require relationships rather than retrieval alone, let’s talk.

Author
Maciej Szukalski
Founder of Condictor · systems architect · research and development
He has designed and built digital products since 2014. He specialises in architecture, research, and applications with automation and intelligence layers.
See experience and working principlesHave a problem to solve?
Let’s find the right first step
Describe your situation in a few sentences. We’ll return with questions or a concrete proposal for what comes next.